Understanding Candlestick Shadows in Stock Trading
In stock trading, candlestick charts are a popular tool used by analysts to visualize price movements over a given period. Candlestick charts consist of individual "candles," each representing a specific time frame, such as a day, week, or hour. Each candle has a body and two wicks, also known as shadows or tails. The length and position of these shadows provide valuable insights into market sentiment and potential price reversals.
Anatomy of a Candlestick
Before delving into the significance of shadows, let's understand the components of a candlestick:
1.
Body
: The rectangular area between the open and close prices of the period. If the close is higher than the open, the body is typically filled or colored, representing bullishness (buying pressure). Conversely, if the close is lower than the open, the body is usually hollow or differently colored, indicating bearishness (selling pressure).
2.
Upper Shadow
: The thin line extending from the top of the body to the highest price of the period. It reflects the highest price reached during the timeframe.
3.
Lower Shadow
: The thin line extending from the bottom of the body to the lowest price of the period. It represents the lowest price reached during the timeframe.
Significance of Shadows
Now, let's focus on the shadows:
1.
Length of Shadows
: The length of the upper and lower shadows provides insights into price volatility and market sentiment. Longer shadows suggest greater price fluctuations during the period, indicating increased uncertainty or indecision among traders.
2.
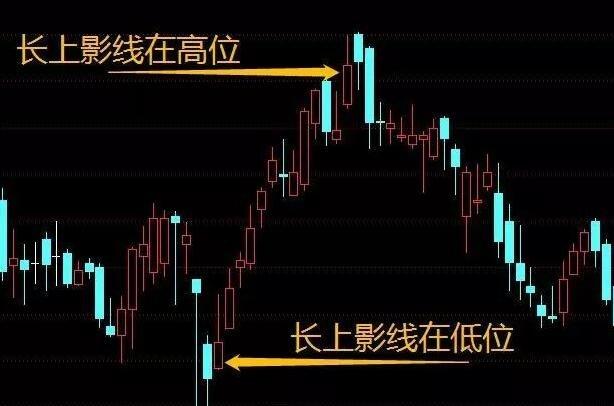
Upper Shadow
: A long upper shadow indicates that the price rose significantly during the period but retreated from the highs, signaling potential selling pressure or resistance at higher levels. It suggests that despite bullish attempts, sellers managed to push the price down.
3.
Lower Shadow
: Conversely, a long lower shadow suggests that the price fell sharply but rebounded from the lows, indicating buying interest or support at lower levels. It implies that despite bearish pressure, buyers were able to push the price up.
Interpreting Shadows in Trading
Here's how traders interpret shadows to make informed decisions:
1.
Long Upper Shadow
: Traders may interpret a long upper shadow as a sign of potential reversal from bullish to bearish momentum. It could indicate that buyers failed to sustain higher prices, and sellers are gaining control, possibly leading to a price decline.
2.
Long Lower Shadow
: Conversely, a long lower shadow may signal a potential reversal from bearish to bullish momentum. It suggests that despite initial selling pressure, buyers stepped in to support the price, indicating a possible upward movement.
3.
EqualLength Shadows
: When both upper and lower shadows are of similar length, it reflects a tugofwar between buyers and sellers, indicating indecision in the market. Traders often wait for confirmation through subsequent price action before making trading decisions.
Conclusion
In stock trading, understanding the significance of candlestick shadows is crucial for gauging market sentiment and predicting potential price movements. By analyzing the length and position of shadows relative to the candle bodies, traders can make informed decisions about buying, selling, or holding positions. However, it's essential to complement candlestick analysis with other technical indicators and fundamental analysis for comprehensive market analysis and risk management.
Invest wisely, and may your trades be profitable!
The content above provides a comprehensive overview of candlestick shadows in stock trading, covering their significance, interpretation, and implications for traders. If you need further clarification on any aspect or wish to explore additional topics related to stock trading, feel free to ask!